Create a graphical diagram

  • Status: Closed
  • Prize: £90
  • Entries Received: 12
  • Winner: vivekdaneapen

Contest Brief

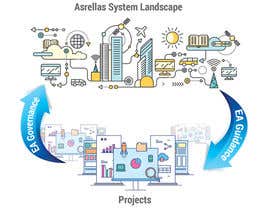
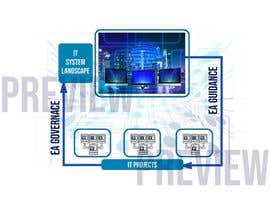
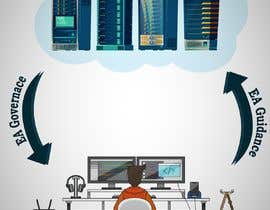
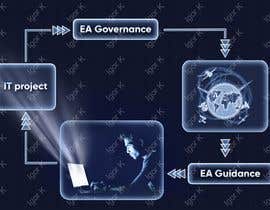
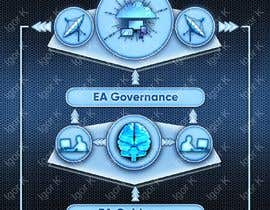
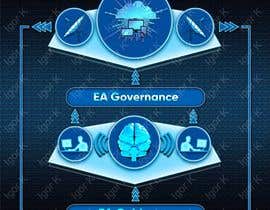
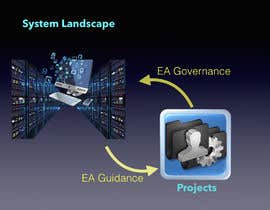
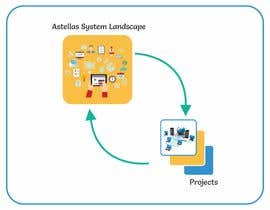
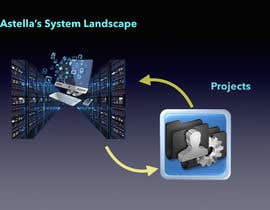
I want to create a rich graphical diagram showing the interplay between IT projects and the IT systems landscape. Attached is a sketch of what I have in mind but I need this to look rich and attractive.

Recommended Skills

Employer Feedback

“Outstanding - very responsive”

Profile image paulmukherjee9, United Kingdom.

Top entries from this contest

View More Entries

Public Clarification Board

  • paulmukherjee9
    Contest Holder
    • 5 years ago

    Thanks to everyone who contributed. I have now award the prize.

    • 5 years ago
  • sudhy8
    sudhy8
    • 5 years ago

    working on it...please wait

    • 5 years ago
  • program23
    program23
    • 5 years ago

    The task is not entirely clear. Need more information.

    • 5 years ago
  • garik09kots
    garik09kots
    • 5 years ago

    Check please No. #6

    • 5 years ago
  • paulmukherjee9
    Contest Holder
    • 5 years ago

    For the arrow FROM the projects TO the landscape it should be decorated with the text "EA Governance"

    • 5 years ago
  • paulmukherjee9
    Contest Holder
    • 5 years ago

    For the arrow FROM the landscape TO the projects, it should be decorated with the text "EA Guidance"

    • 5 years ago
  • paulmukherjee9
    Contest Holder
    • 5 years ago

    https://www.shutterstock.com/image-vector/vector-illustration-service-oriented-architecture-different-188131670?src=i0sYQYyRvtFFEoVuxcR01w-1-2

    • 5 years ago
  • paulmukherjee9
    Contest Holder
    • 5 years ago

    https://www.dragon1.com/examples/enterprise-architecture-blueprint

    • 5 years ago
  • paulmukherjee9
    Contest Holder
    • 5 years ago

    https://wiki.scn.sap.com/wiki/display/BOBJ/Linux+System+Landscape+Overview

    • 5 years ago
  • paulmukherjee9
    Contest Holder
    • 5 years ago

    All, to get an idea of the kind of system landscape I have in mind please see the following diagrams

    • 5 years ago
  • program23
    program23
    • 5 years ago

    Hello, please wait my entry.

    • 5 years ago
  • paulmukherjee9
    Contest Holder
    • 5 years ago

    Thanks for the entries so far and also the questions. The purpose of the diagram is to show the interplay between IT projects that are being executed and their impact on the overall IT landscape. There should therefore be representation of the overall IT landscape and the projects being executed with arrows going between the two. I will also want to be able to decorate the arrows with text to illustrate how projects depend on the landscape and then how projects change the landscape. I hope this helps but please feel free to raise further questions.

    • 5 years ago
  • Xenze
    Xenze
    • 5 years ago

    More info please...

    • 5 years ago
  • imageincreations
    imageincreations
    • 5 years ago

    Hello Sir,
    Please check my entry #3
    Thanks!

    • 5 years ago
  • imageincreations
    imageincreations
    • 5 years ago

    Hello Sir,

    • 5 years ago
  • Rouqa
    Rouqa
    • 5 years ago

    Could you plz provide more info, details and text so we can start work on the design. Thank you

    • 5 years ago
  • ehowlim
    ehowlim
    • 5 years ago

    Hi there, could you please provide more details. Thanks

    • 5 years ago

Show more comments

How to get started with contests

  • Post your contest

    Post Your Contest Quick and easy

  • Get tons of entries

    Get Tons of Entries From around the world

  • Award the best entry

    Award the best entry Download the files - Easy!

Post a Contest Now or Join us Today!